Nequasset Fish Count Results
2012-2025


Each year since 2012, volunteers have counted fish at the Nequasset Fish Ladder during the annual alewife run. Counts take place from 6am to 8pm. Volunteers sign-up for two hour blocks and then count fish for two 10 minute periods in the block. We enter the results from these counts into a model developed by the Massachusetts Division of Marine Fisheries and are able to estimate the total number of fish that make it into Nequasset Lake each year. It takes most alewives about 4 years to grow to adults and then return to the lake to spawn, and it looks like we might be seeing evidence of that 4 year cycle in the fish count numbers.
Fish Counted
Estimated Fish into the Lake
2,766
29,916
5,572
40,841
19,061
150,950
9,308
126,395
8,796
43,320
3,230
25,545
15,077
220,000
Fish Counted
Estimated Fish into the Lake
5,073
65,000
5,908
48,000
16,109
82,000
5,861
60,000
14,952
200,000
30,620
250,000
9,426
82,500
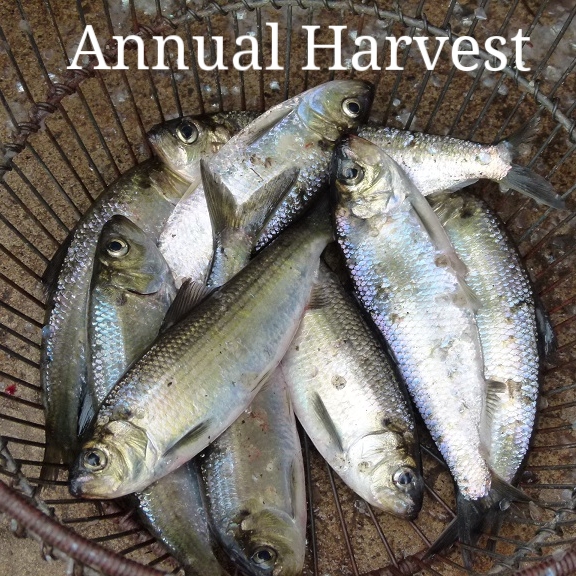
The Woolwich Fish Commission coordinates an annual harvest at Nequasset Dam each year. The harvest operates from Thursday through Sunday each week. Most of the fish are sold for bait, and some are sold salted and smoked. Find out more about the history of the harvest here.
Fish Harvested
133,320
86,100
117,360
173,880
80,160
92,040
163,020
Fish Harvested
188,760
103,680
77,520
78,180
169,200
215,640
121,920
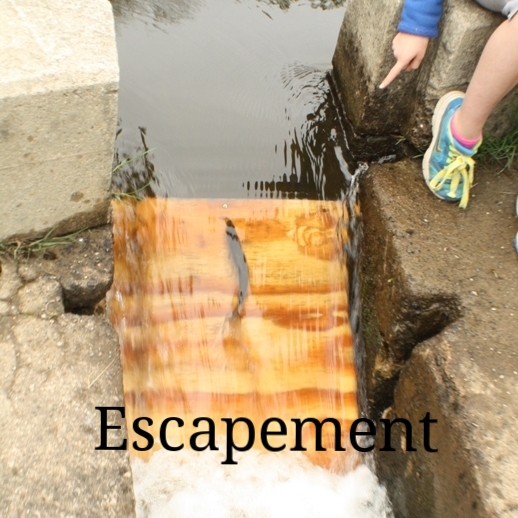
Escapement is an estimate of the percent of all the alewives that arrive at Nequasset Dam each year that are able to make it over the dam and into the lake. To get the total number of fish that arrive at the dam, we add together the number of fish harvested and the number of fish that make it into the lake. The Maine DMR has figured out that at least 15% of the fish need to make it into the lake for the run to be sustainable. Weather, issues with the fish ladder, and timing of the run can all influence the escapement.
% Escapement
18%
32%
56%
42%
35%
22%
57%
% Escapement
26%
32%
51%
43%
54%
54%
40%
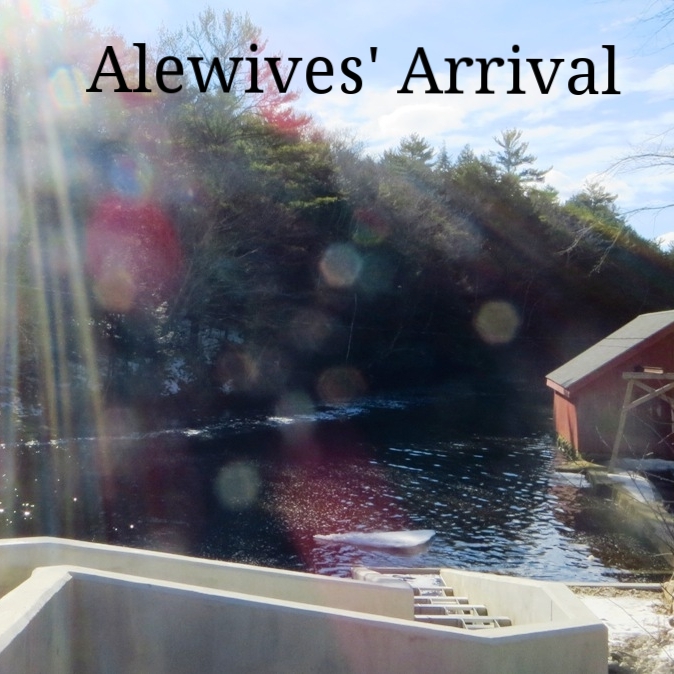
Water temperature plays an important role in the date that the fish first start climbing the fish ladder. Because they have more energy when the water is warmer, they don’t climb the ladder if the water is too cold. Fish usually start climbing the ladder at Nequasset when the water temperature is in the mid 50s.
Date
Lake Temperature (°F)
April 18
56
April 30
55
May 8
55
May 7
58
May 3
52
May 10
53
May 2
55
Date
Lake Temperature (°F)
May 9
55
May 11
47
April 29
50
May 11
58
May 6
55
April 27
52
May 2
49.5
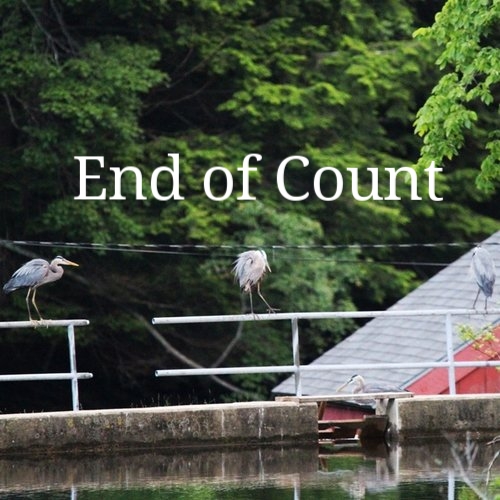
The count typically ends when there are very few fish entering the lake, and the number of fish leaving the lake far outnumbers the number entering.
Date
June 2
June 7
June 9
June 8
June 4
June 7
June 3
Date
June 7
June 7
June 1
June 3
June 4
June 2
June 5
The annual alewife count at Nequasset would not be possible without many amazing volunteers. Thank you to everyone who has taken part!
Volunteers
73
69
95
72
78
118
86
Volunteers
90
168
195
119
122
185
123